
At the present, Georgia is a poor country, or to put it in more academic language – Georgia is a low-income country. Georgia’s per capita income is several times less than other developed countries. This income is determined by the volume of the country’s economy (GDP) and the population rate. For the past 27 years, the population rate has decreased from 5 million to 3.7 million, which means than the income is now divided among less people. This is still not sufficient. According to the data of 2016, 21% of the population lives in extreme poverty. The annual per capita PPP is $3,853 (₾9,118). Georgia is 111thin the world in terms of average per capita PPP.
As an economic experiment, let’s travel in time to see how rich or poor Georgia could be now if the economy had developed in a different way. Let’s also explore when and in what case we would have lived in a wealthy Georgia similar to other high-income western countries.
Methodology
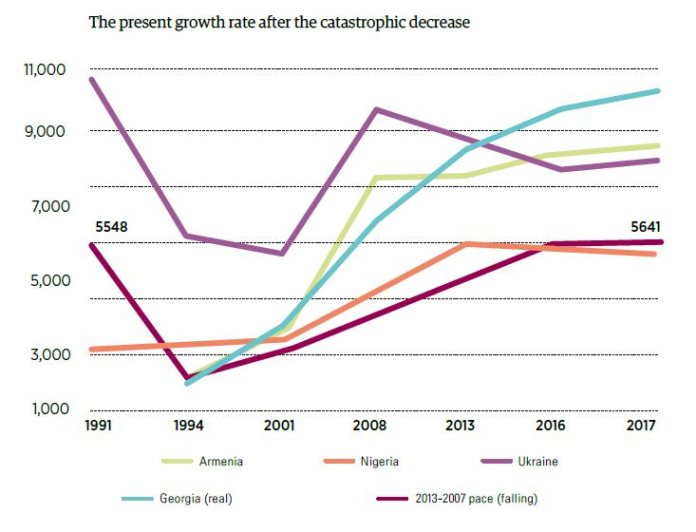
According to the data provided by the International Monetary Fund (IMF), the average annual per capita PPP in Georgia was $5,548 PPP (price in 2011). In the three consecutive years that followed, this indicator decreased by 61%, and in 1994, the average annual per capita PPP was $2,142 (price in 2011). The PPP dollar means taking into account purchasing power parity when the prices remain unchanged. When used for comparing different countries, this methodology annulled factors such as fluctuations in the exchange rate, differences in prices in various countries, or to put it simply –one dollar has the same purchasing power every year (since 1991 including 2017) in every country. That is why we decided to compare Georgia with other countries based on per capita PPP dollars. The increase/decrease of per capita income is determined by economic growth and population rate fluctuations.
Scenario 1:
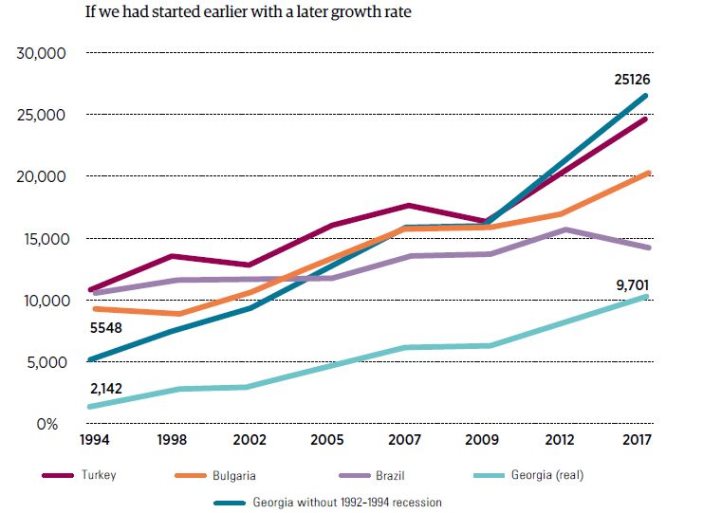
Where would we be now if per capita PPP in Georgia had not decreased catastrophically from 1992-1994 and if in 1994 we had remained on the same level as in 1991. Would everything develop in the same way as it actually did (from 1995-2017 the average growth rate of per capita PPP in Georgia was 7%)? In that case, in 2017, per capita PPP in Georgia would be 2.6 times more (than it actually is) and would reach $25,126 PPP. We would be ahead of Brazil in 2005, Bulgaria in 2007 and beat Turkey in 2012. We could have been closer to Russia and Greece, while as things are now, Georgia is closer to Equator, Kosovo and Swaziland in terms of income rate.
Scenario 2:
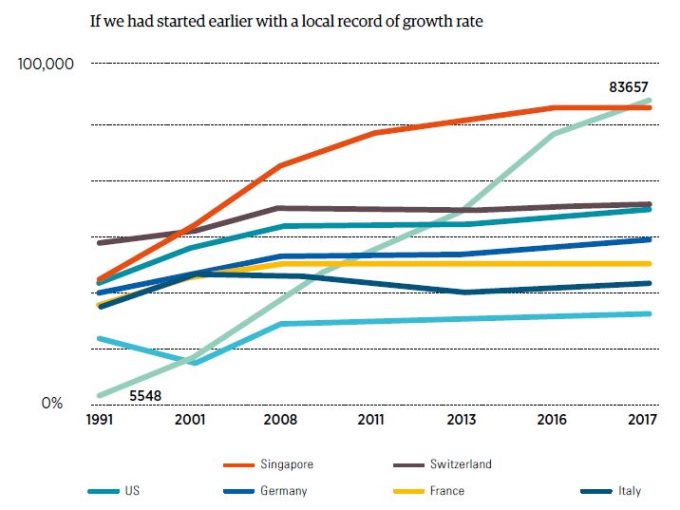
Where would we be now if per capita PPP in Georgia had not decreased catastrophically from 1992-1994 and if in 1994, we had remained on the same level as in 1991, and if then we had a stable annual growth of 11% like we had from 2003-2007. In that case, the per capita PPP in 2017 would have reached $83,657 PPP and the only countries of the world wealthier than Georgia would have been Qatar and Luxemburg. In 2001, we would beat Russia and in 2010-2011 we would be ahead of Italy, France and have caught up with Switzerland. In 2017, we would have forced Singapore to give up third place.
Scenario 3:
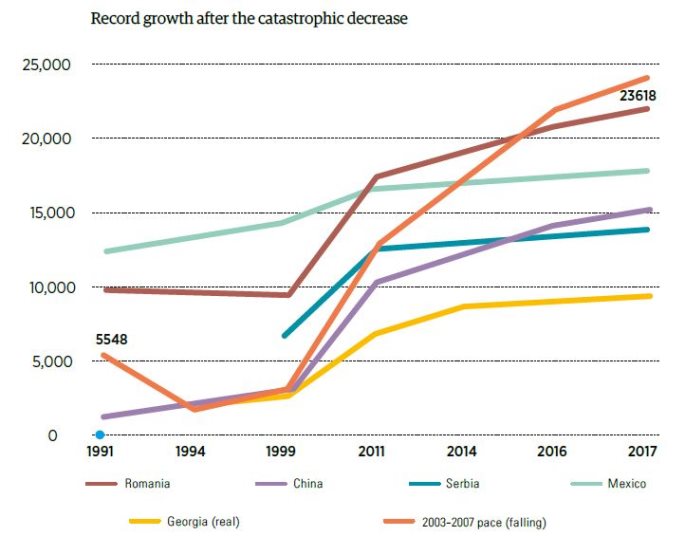
Where would we be now if per capita PPP in Georgia had indeed decreased catastrophicallyin 1992-1994, as it really happened, but if from 1995 we had stable annual growth of 11% like we had from 2003-2007? In that case, the per capita PPP in 2017 would have been $23,618 PPP. In 1999, we would have been ahead of China, in 2011 – Serbia, in 2014 – Mexico and in 2016 – Romania.
Scenario 4:
Where would we be now, if per capita PPP in Georgia had indeed decreased catastrophically from 1992-1994 and in 1994, had remained on the same level as in 1991, and then from 1994 per capita PPP would have increased at the average economic growth pace of 2013-2017 – 4.3%? In that case, the per capita PPP would have been $5,641 PPP, which is 1.7 times less than the actual figure. From 2000, many countries that are now poorer than Georgia, like Armenia, Nigeria and others would be ahead of us
Scenario 5:
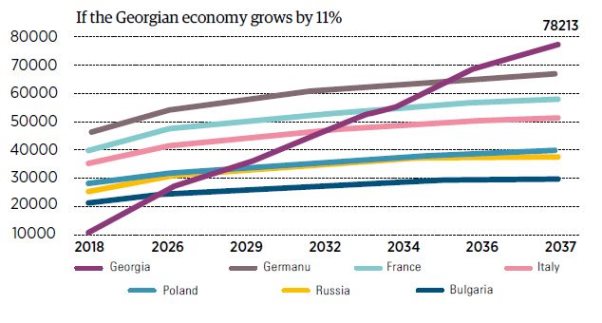
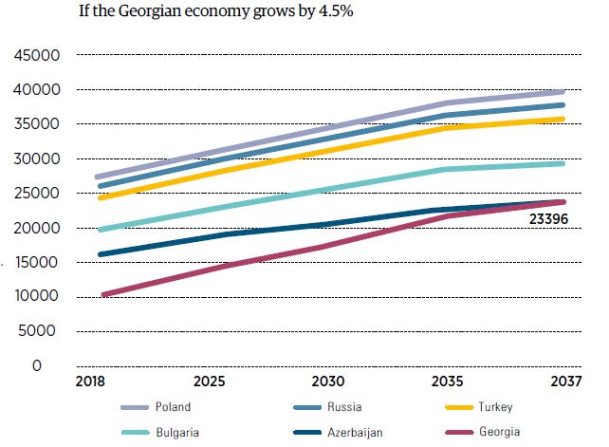
In this last scenario, let us consider when we would be able catch up with high-income countries given three different growth paces in the course of 20 years. Let’s say that from 2018 annual per capita PPP grows by 4.5% (the forecasted growth pace of the government of Georgia for 2018), or has the average growth rate of 7.5%, or it grows by 11% as was the case from 2003-2007. Let’s say that average annual economic growth rate in the comparable target countries is 2%.
If the economy of Georgia (hence, the per capita PPP) grows by 4.5% annually, in 2037, per capita PPP would be $23,396 PPP and we won’t be able to catch up with the developed countries. In 2037, we could catch up with Azerbaijan, assuming that its economy grows by 2%.
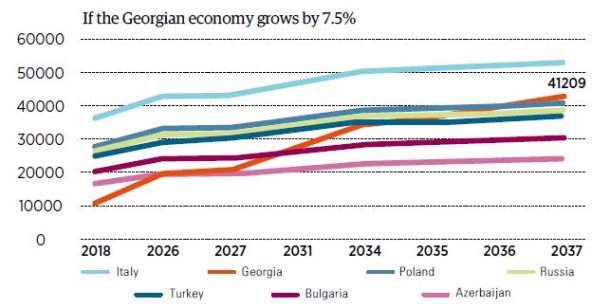
If the economy of Georgia (hence, the per capita PPP) grows by 7.5% annually, in 2037, per capita PPP would be $41,209 PPP. In 2027, we would be ahead of Azerbaijan, in 2031 – Bulgaria, which is currently considered the country with the lowest income in the EU, in 2035 – Turkey, in 2036 – Russia and in 2037 – Poland.
If the economy of Georgia (hence, the per capita PPP) grows by 11% annually, in 2037, per capita PPP would be $78,213 PPP. From 2026, we would be ahead of Bulgaria, in 2029 – Russia and Poland, in 2032 – Italy, 2034 – France and 2036 – Germany.