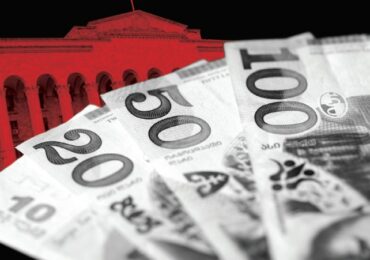
In the third quarter of 2018 the real estate market grew by 2.4% compared to the second quarter, a significant growth (24.3%) compared to last year. According to TBC bank, ISET and ForSet joint research, Real estate market growth is mainly due to the Tbilisi real estate market. 44% of sales are in Tbilisi.
The most active neighborhood in Tbilisi is Saburtalo, which takes 27% of the share of the sales, followed by Vake (16.1%), and Gldani (12.2%).
According to the neighborhoods of Tbilisi, the average price of real estate is as follows:
• Mtatsminda – $ 1099 (sq.m) Growth compared to previous year + 7.3%
• Vake – $ 972 (sq.m.) Growth compared with previous year + 5.3%
• Saburtalo – $ 893 (sq.m.) Growth compared with previous year + 2%
• Krtsanisi – $ 829 (sq m) Growth in comparison with previous year + 2.3%
• Didube – $ 783 (sq m) Growth in comparison with previous year + 12.4%
• Chugureti – $ 771 (sq.m) Growth compared with previous year + 2.9%
• Isani – $ 682 (sq.m) Growth in comparison with previous year + 2.6%
• Nadzaladevi – $ 628 (sq.m) Growth in comparison with previous year + 12.4%
• Gldani – $ 570 (sq.m.) Growth compared with previous year + 9.9%
• Samgori – $ 546 (sq.m) change in comparison with the previous year -2.5%
With regard to rent, the cost is highest in Mtatsminda and the per square meter cost in Tbilisi neighborhoods are as follows:
• Mtatsminda – $ 7.772 (sq.m) Change in comparison with the previous year -13.9%
• Vake – $ 7.36 (sq m) Change in comparison with the previous year -8.1%
• Krtsanisi – $ 7.05 (sq.m) Change in comparison with the previous year -9.8%
• Chugureti – $ 6.78 (sq.m.) Change compared with previous year + 4.4%
• Saburtalo – $ 6.75 (sq.m) Change in comparison with the previous year -3.1%
• Isani – $ 6.69 (sq m) Change in comparison with previous year + 2.5%
• Didube – $ 6.05 (sq.m) Change in comparison with the previous year -0.9%
• Samgori – $ 5.69 (sq m) Change in comparison with previous year + 19%
• Nadzaladevi – $ 5.32 (sq.m) Change in comparison with previous year + 0.6%
• Gldani – $ 4.68 (sq.m.) Change compared with the previous year -0.3%
დატოვე კომენტარი