Were people more frugal during the pandemic or did they break the bank? This visual assesses the saving rates across different countries.

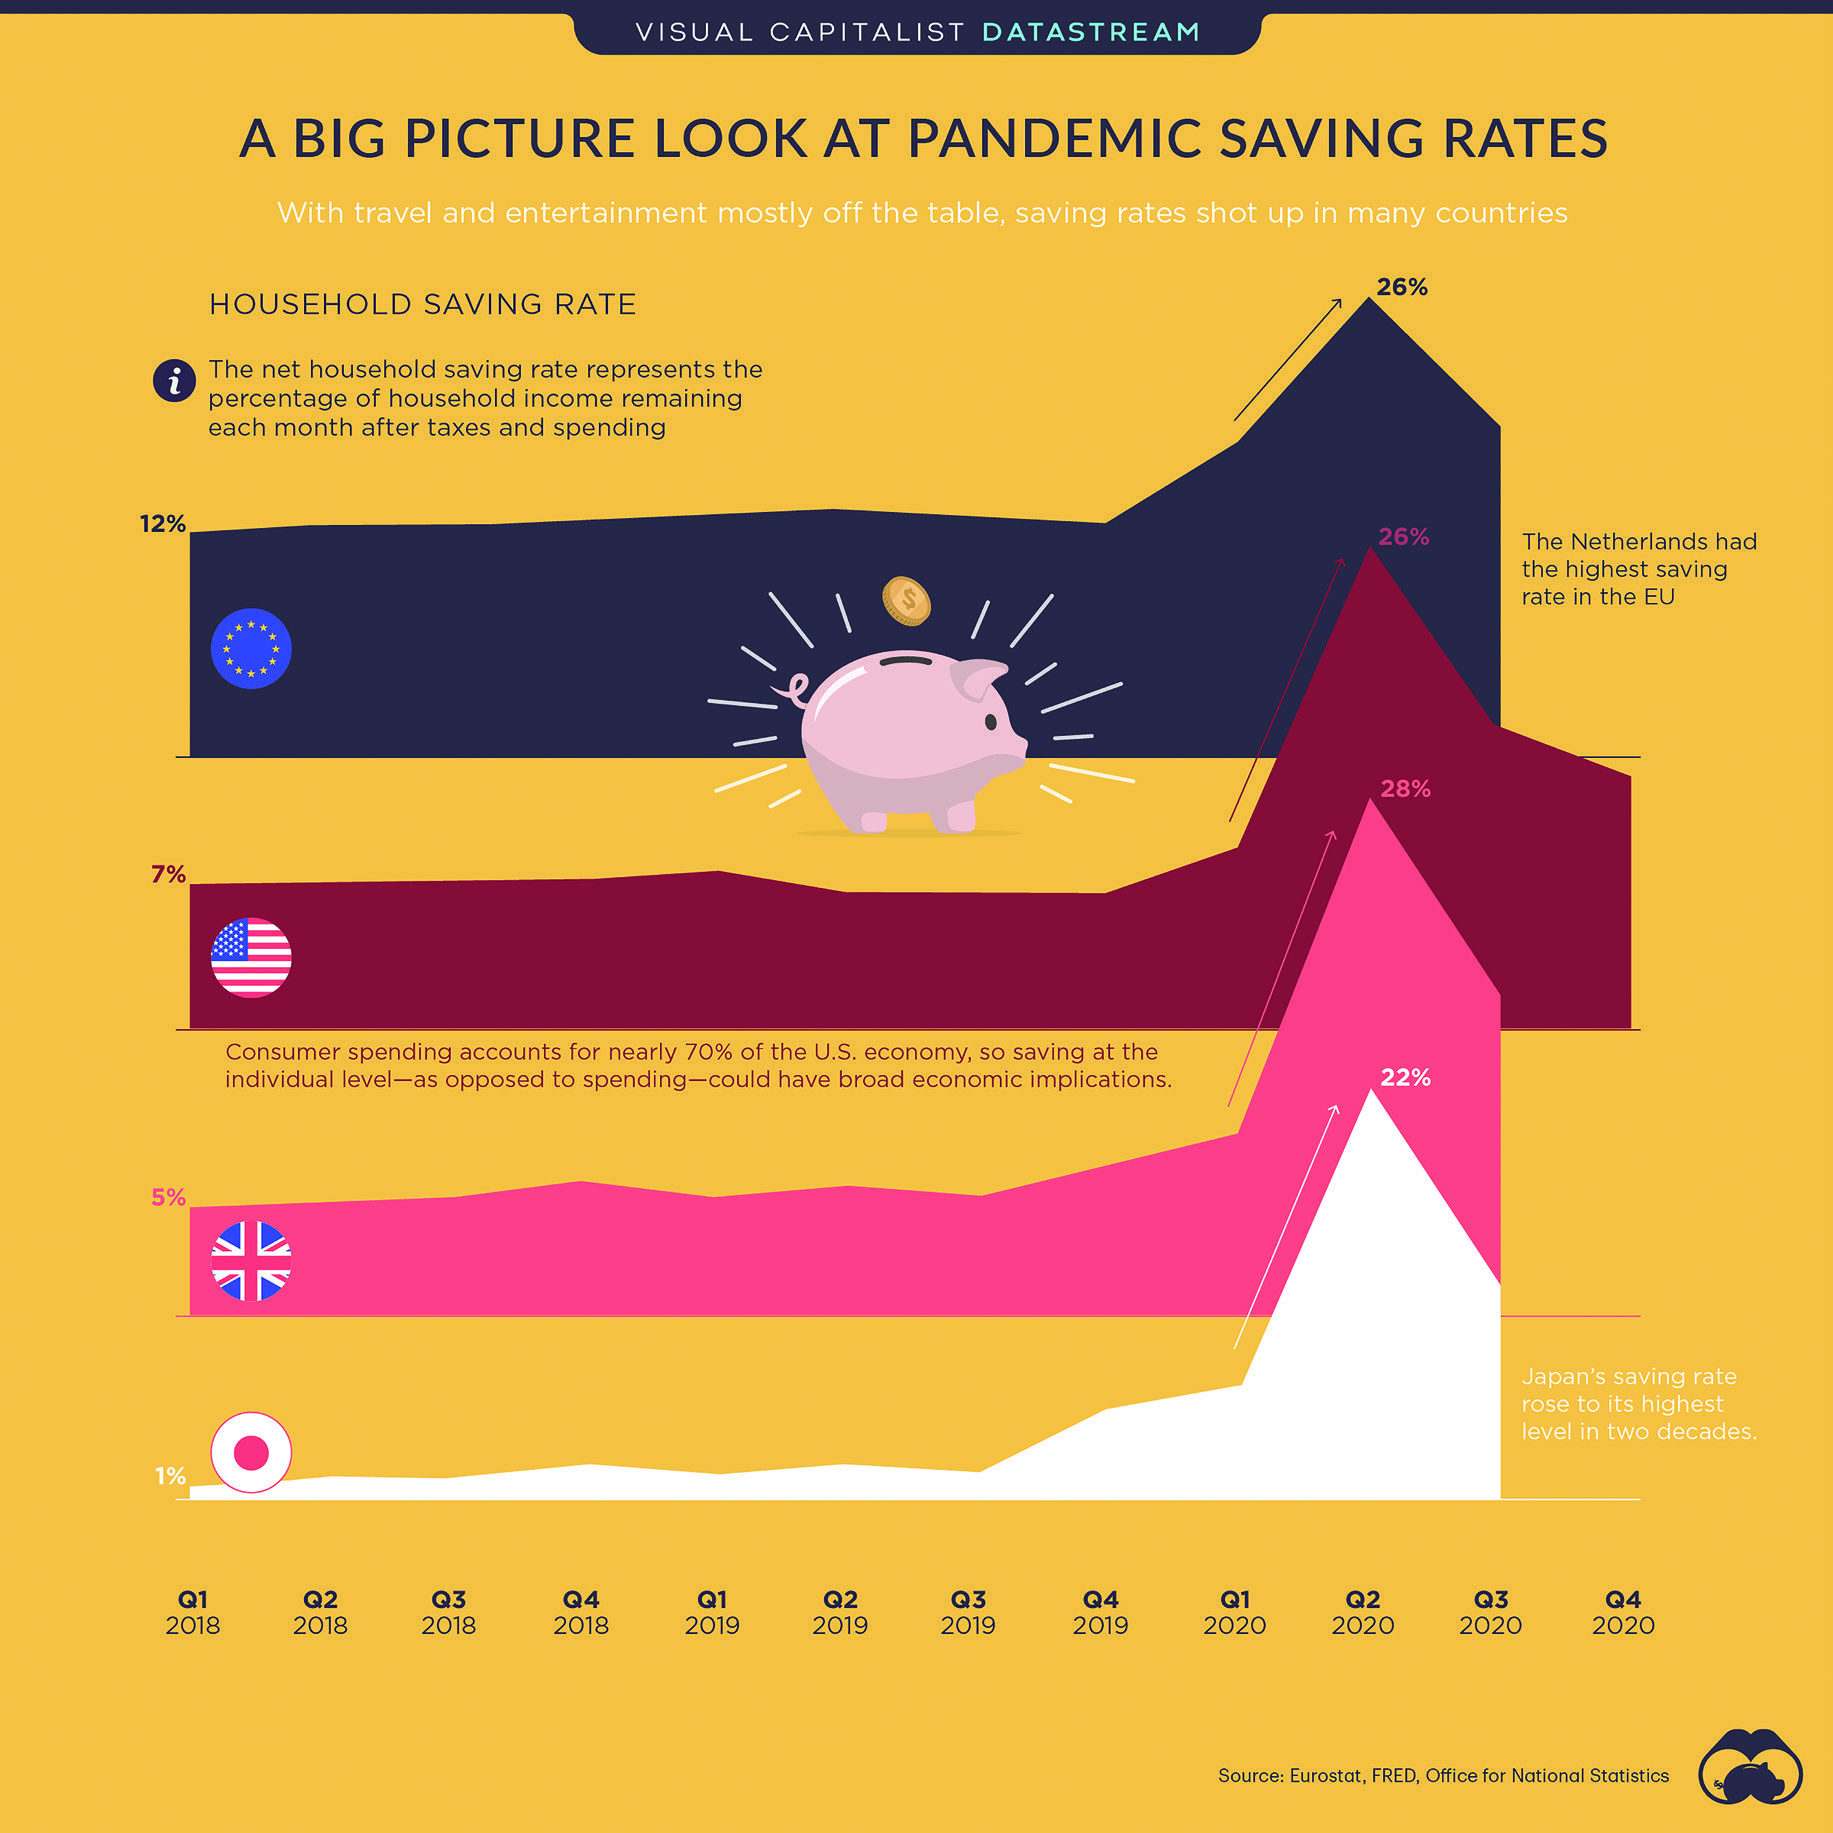
While working hours were reduced across the globe and many lost their jobs entirely, personal saving rates actually increased throughout the pandemic in many countries.
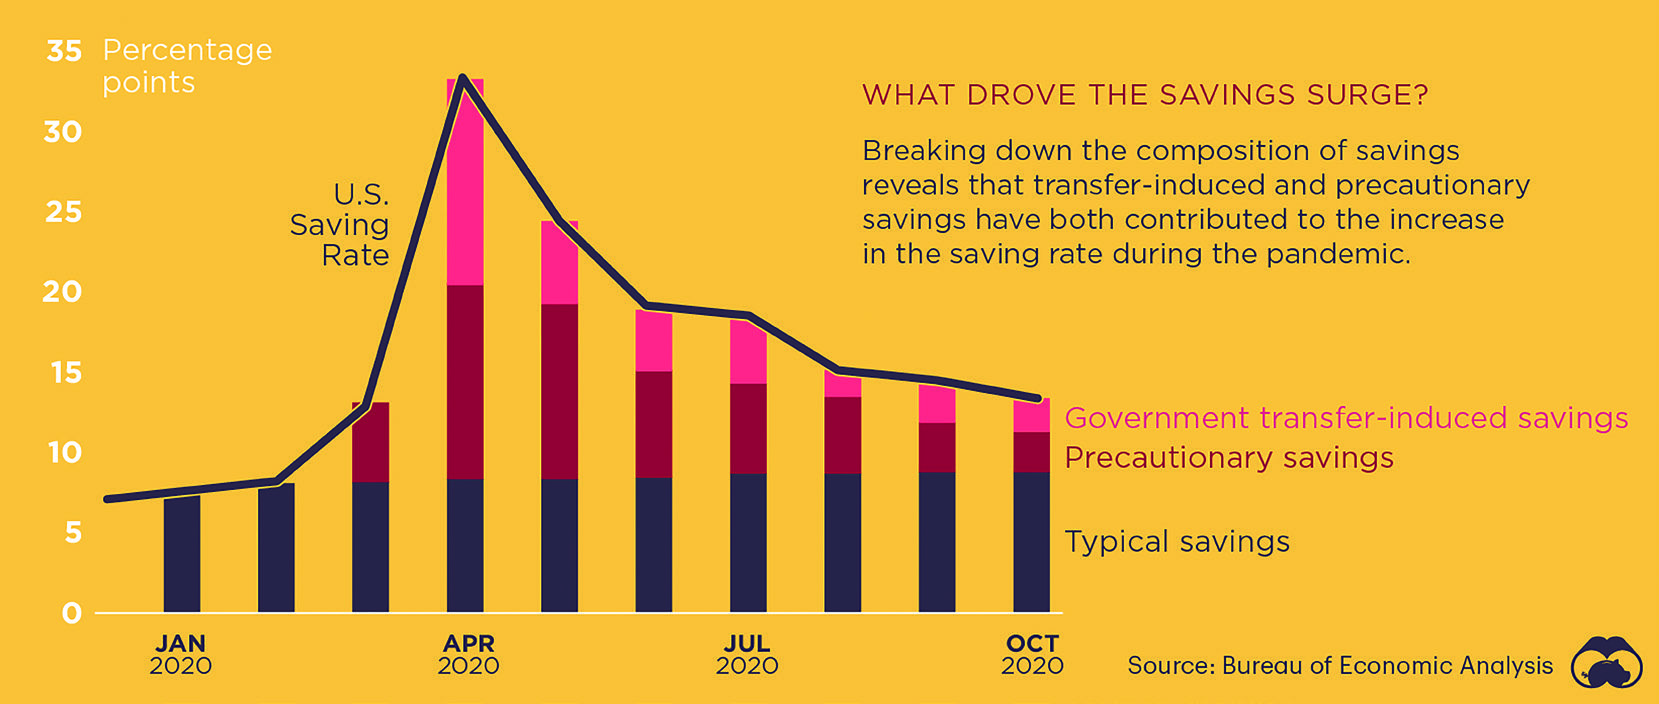
A personal saving rate is calculated as the ratio of personal saving to disposable personal income. Here’s a look at the U.S.’ personal saving rate over 2020.
Date | U.S. Saving Rate |
| January 2020 | 7.6% |
| February 2020 | 8.3% |
| March 2020 | 12.9% |
| April 2020 | 33.7% |
| May 2020 | 24.7% |
| June 2020 | 19.0% |
| July 2020 | 18.4% |
| August 2020 | 14.6% |
| September 2020 | 14.1% |
| October 2020 | 13.2% |
| November 2020 | 12.5% |
| December 2020 | 13.4% |
| January 2021 | 20.5% |
The U.S.’ personal saving rate skyrocketed in April to more than 30%. After a dip near the end of 2020, the rate has jumped back up again to around 20% in January 2021.
With the most recent data from September 2020, many European countries’ savings rates were up, as well—the highest rate occurred in the Netherlands at 24%. Japan and the UK followed a similar trend as well, at 22% and 28% respectively.
The Pandemic Piggy Bank
Personal saving rates tend to increase during recessions and, more generally, either increase because of reduced consumption or a boost in income.
Without the same access to restaurants, shopping, and travel, it is somewhat unsurprising that a trend of increased saving rates occurred.
Overall, the typical saving rates have not changed; what has driven up the country’s rates has been prudence and government checks. Whether or not this will influence future consumption or will continue a trend of increasingly large nest eggs, however, has yet to be determined.
The U.S. will likely see an increased inflow of government support, as Joe Biden’s $1.9 trillion stimulus package has recently passed in Congress.

Originally Published on Visual Capitalist.
Content Writer at Visual Capitalist


